


Description
Introduction: What is the Chaikin Oscillator Indicator?
The Chaikin Oscillator is a momentum-based technical indicator that blends price and volume to detect accumulation and distribution in financial markets. Developed by Marc Chaikin, this tool is especially effective in identifying early signs of trend reversals and market pressure shifts—making it a favorite among professional and retail traders alike.
It works by calculating the difference between a 3-day and 10-day exponential moving average (EMA) of the Accumulation/Distribution Line (ADL), offering a real-time view of buying and selling strength.
👉 Who is it for?
• Traders who want to incorporate volume-based momentum into their strategies
• Anyone looking to anticipate reversals through divergence analysis
• Scalpers, swing traders, and position traders who rely on trend confirmation
Key Features
- Volume + Price Analysis
- The Chaikin Oscillator uniquely blends volume with price action to measure the strength of buying and selling pressure.
• 🚀 Suggested Image: A chart highlighting the oscillator rising above/below the zero line alongside candlesticks.
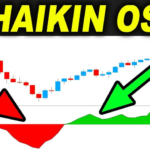
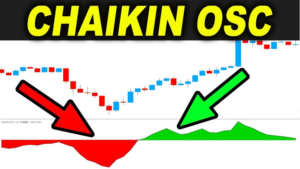
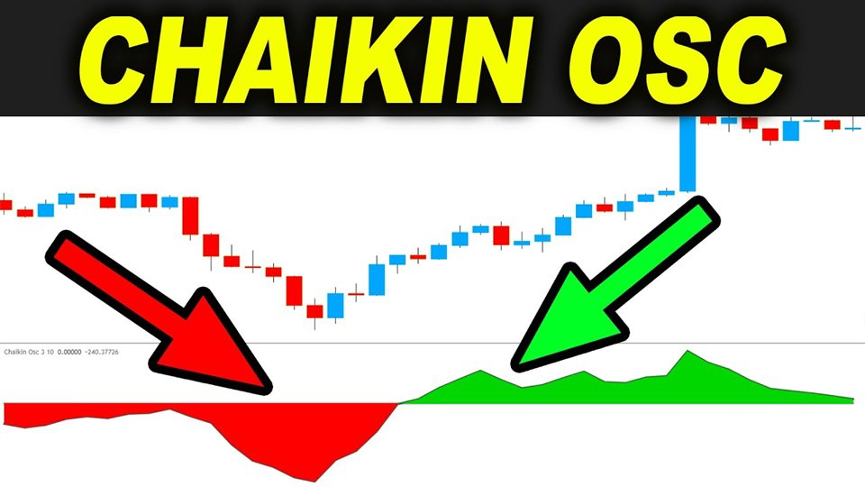
- Divergence Detection
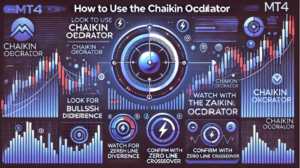
- Spots bullish divergence (price making lower lows while the oscillator makes higher lows) and bearish divergence (price making higher highs while the oscillator makes lower highs). These can hint at potential market reversals.
• 🚀 Suggested Image: Side-by-side examples of bullish and bearish divergences marked on a chart.
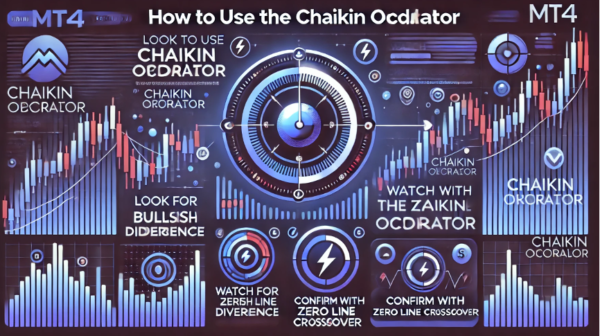
- Zero Line Crossover Strategy
- Buy signal: Oscillator crosses above the zero line, signaling strength in buying momentum
• Sell signal: Oscillator crosses below the zero line, signaling increased selling activity
- Trend Confirmation Tool
- Best used alongside trendlines, moving averages, and support/resistance for confirming the strength and direction of market trends.
- Trade Management Support
- Great for refining entry and exit timing based on volume pressure. Use with your stop-loss and position sizing rules to maintain effective risk control.
How Does It Work?
The Chaikin Oscillator is built on the Accumulation/Distribution Line (ADL), which tracks whether volume is flowing into or out of an asset. By applying two EMAs to the ADL—a short-term (3-day) and a longer-term (10-day)—the oscillator reveals shifts in momentum.
- When the short-term EMA rises above the long-term EMA, the oscillator turns positive—indicating accumulation.
• When the short-term EMA dips below, it signals distribution.
Traders can look for zero line crossovers or divergences between price and the oscillator to catch early trend signals. Confirm these moves with broader technical analysis to improve decision-making.
Advantages
✅ Combines Volume & Price: Offers deeper insight than price-only indicators
✅ Great for Divergence Signals: Early warning system for trend shifts
✅ Flexible Use: Adaptable to different trading styles and instruments
✅ Trend Confirmation: Aligns well with other tools to increase signal accuracy
Things to Note
⚠️ Not Standalone: Best used with additional technical analysis for confirmation
⚠️ False Signals Possible: Like any indicator, divergences can sometimes fail—risk management is key
⚠️ Requires Monitoring: Traders should observe the oscillator in real-time and not rely solely on static signals
Conclusion
The Chaikin Oscillator is a sophisticated yet practical tool that gives traders a window into market sentiment through volume dynamics. With its ability to detect accumulation/distribution phases and highlight divergence opportunities, this indicator can enhance any trader’s strategy—whether you’re looking to ride trends or spot reversals early.
📊 Visual Suggestions:
• Annotated chart showing zero line crossovers with volume spikes
• Example of divergence between price and oscillator
• Overlay of oscillator with moving averages for trend confirmation


